In the digital age, where speed and efficiency are paramount, website performance has become a cornerstone of success. Every millisecond of delay can lead to lost conversions, decreased engagement, and a higher bounce rate. In this pursuit of speed, Google PageSpeed Insights (PSI) emerges as a vital tool for webmasters and digital marketers to measure and improve the speed and overall performance of their websites. Yet, even with all its authority, Google.com itself often doesn’t achieve a perfect score of 100, highlighting the inherent complexities of website optimization.
What Is Google PageSpeed Insights?
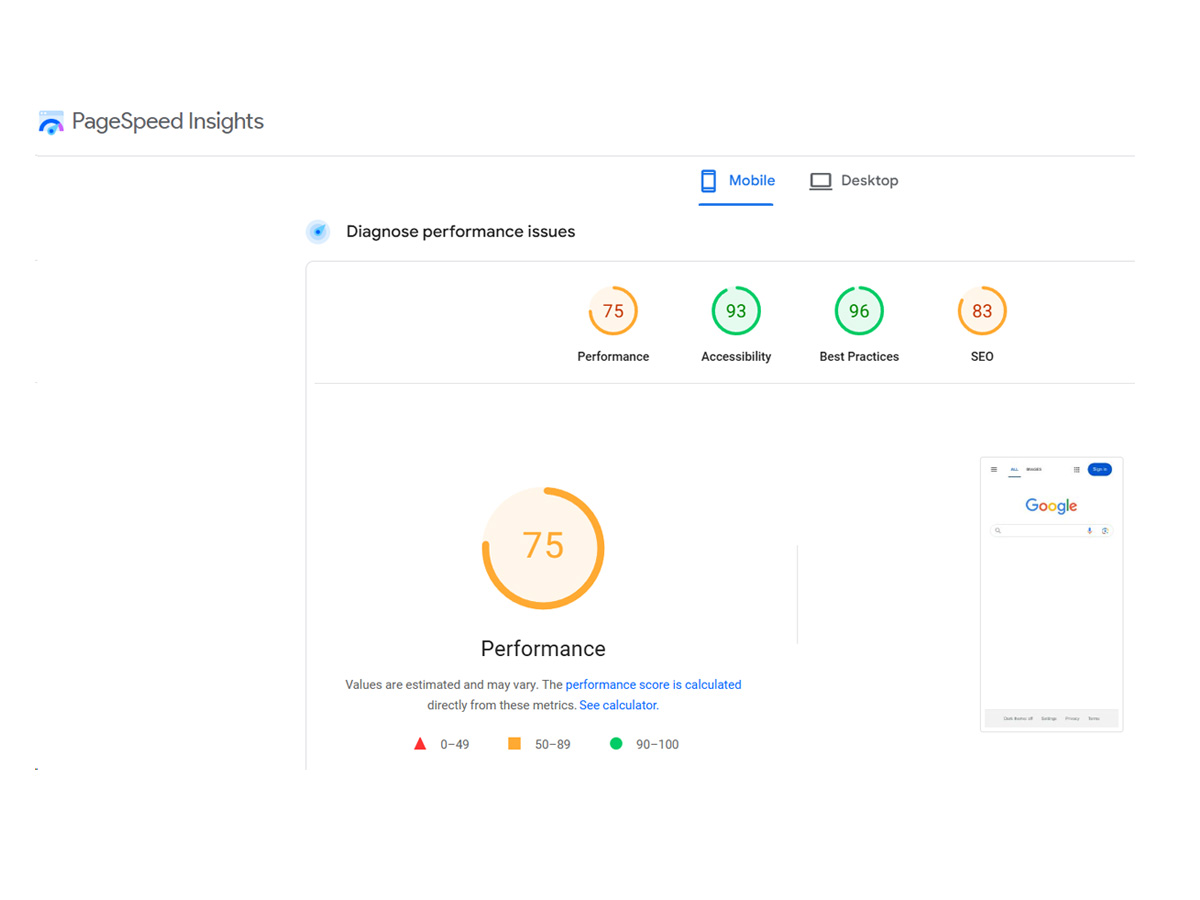
Google PageSpeed Insights is a free tool designed by Google to help webmasters assess the performance of their websites on both mobile and desktop devices. Using a blend of laboratory and field data, it measures different aspects of the user experience, assigning a score between 0 and 100. The tool evaluates several metrics collectively known as Core Web Vitals, which focus on speed, interactivity, and visual stability. PageSpeed Insights not only gives a snapshot of the current performance but also offers actionable recommendations to help developers and site owners enhance their page speed.
The Core Web Vitals consist of three main metrics: Largest Contentful Paint (LCP), First Input Delay (FID), and Cumulative Layout Shift (CLS). These elements, alongside other performance indicators such as First Contentful Paint (FCP) and Time to Interactive (TTI), contribute to the overall PSI score. However, achieving a perfect score of 100 is often considered a gold standard that even the most meticulously optimized websites rarely attain.
The Challenges of Achieving a Perfect 100
It’s essential to understand that a perfect score of 100 on Google PageSpeed Insights is not necessarily an indicator of success. Even major websites like Google.com, with vast resources and engineering capabilities, usually fall short of a 100 score. Why is this the case?
For starters, websites today are more than just simple HTML pages. The features and functionalities that enhance user experience often come with trade-offs in performance. For instance, dynamic content, JavaScript interactivity, responsive designs, and multimedia assets add significant weight to a page. While these features are essential for an engaging user experience, they also contribute to longer loading times, increased server requests, and potential layout shifts.
Moreover, PageSpeed Insights employs simulated testing conditions to assess website performance. These conditions, while representative, cannot fully replicate every possible scenario of real-world users. Variations in internet speed, device types, and user locations create a diverse array of conditions under which a site must operate. Google.com, with its plethora of features and worldwide user base, faces these same challenges. It must balance usability with speed, which is often a delicate tightrope to walk.
The Role of Core Web Vitals
One of the most significant updates in Google PageSpeed Insights has been the emphasis on Core Web Vitals, a set of metrics that help quantify the user experience. These vitals have become an integral part of Google’s page ranking algorithm, highlighting their importance in today’s web environment. Understanding how these factors influence the PSI score is crucial:
- Largest Contentful Paint (LCP): LCP measures how quickly the main content of a page loads. The faster the LCP, the quicker users can begin interacting with the page. A good LCP score should be under 2.5 seconds, yet this is challenging to achieve consistently, especially on pages with heavy images, embedded videos, or interactive maps.
- First Input Delay (FID): FID measures the time it takes for the browser to respond to the first user interaction. This could be a click, a tap, or even a keystroke. An optimal FID is under 100 milliseconds. However, pages that rely heavily on JavaScript can experience a lag between user input and browser response, affecting this metric.
- Cumulative Layout Shift (CLS): CLS quantifies how much page elements move unexpectedly while loading. This movement can be disorienting for users and often occurs when images or ads load after the main content has been rendered. A good CLS score is less than 0.1.
These Core Web Vitals are central to the PageSpeed Insights score and illustrate why attaining a perfect score is not always realistic. When even the world’s largest websites struggle with these metrics, it becomes clear that user experience optimization is a continuous journey rather than a one-time achievement.
Balancing Performance with Functionality
One key reason why even Google.com may not consistently score a perfect 100 is the trade-off between performance and functionality. Websites today are not only expected to be fast, but also to provide an intuitive and engaging user experience. This expectation introduces several complexities in development.
For example, Google’s homepage, known for its minimalist design, is still embedded with interactive elements, search suggestions, and backend analytics. These functionalities, while essential, can sometimes impact the PSI score. It’s not a question of neglect, but rather a deliberate choice to enhance usability and functionality at the expense of achieving a perfect PSI score.
Websites designed to serve different user needs often have to strike a balance between essential features and speed. An e-commerce site, for instance, might prioritize high-quality product images to increase sales conversion but must accept the trade-off with page load times. Similarly, media-heavy sites like news portals need to cater to users with engaging videos and interactive elements, which can add to the weight of a page.
Tips for Improving PageSpeed Insights Score
While achieving a perfect score might not always be the primary goal, striving to improve the PSI score can yield tangible benefits in user experience and search rankings. Here are some essential strategies to consider:
- Optimize Images and Videos: Large media files often contribute to slower load times. Compressing images, using next-gen formats like WebP, and optimizing video playback can significantly reduce page weight and improve LCP scores.
- Minify CSS and JavaScript: Minification removes unnecessary characters from code files, reducing their size. Implementing async or defer attributes for JavaScript files also helps in reducing the time to interactive, improving the FID score.
- Leverage Browser Caching: By instructing browsers to cache certain assets, you can reduce the number of server requests needed when users revisit your site. This can improve overall page load times.
- Monitor Third-Party Scripts: External scripts, like ads or analytics services, can significantly impact performance. Regularly audit and optimize third-party integrations to minimize their impact on page load speed and CLS.
Embracing Realistic Goals with PageSpeed Insights
In a digital landscape where every second counts, Google PageSpeed Insights provides invaluable insights into a website’s performance. However, it’s essential to remember that a perfect score of 100 isn’t always the ultimate goal. Even a website as optimized as Google.com doesn’t consistently achieve a perfect score, emphasizing that real-world performance is about finding the right balance between speed, functionality, and user experience.
Instead of chasing an elusive perfect score, webmasters should focus on the fundamentals that drive a great user experience. By optimizing Core Web Vitals, refining media assets, and maintaining a clean codebase, websites can achieve the right blend of speed and usability. In the end, it’s not about achieving perfection but about making continual improvements that benefit users and businesses alike.
Google PageSpeed Insights is a powerful tool, but it’s only one piece of the puzzle. By embracing realistic goals and prioritizing user experience, websites can create lasting impacts that go beyond a simple numerical score.